
What is a PAR Sheet?
A PAR sheet is a spreadsheet-like tool for defining the math model of a slot machine game. PAR is an acronym for Probability and Accounting Report. PAR sheets were originally used when designing physical slot machines. Of course today they are just as effective when designing slot games for online and social casino apps.

Historically, slot machine manufacturers have zealously guarded their PAR sheets as trade secrets. It isn’t easy to find examples of actual PAR sheets for classic slot machine games online. Some have leaked out, but often it has required researchers to petition the manufacturers using Freedom of Information Act laws.
I’ll try to demystify PAR sheets in this and future posts, and show how valuable they are for designing slot machine games.
There is no standard format for a PAR sheet, though they usually include the same things, depending on the game features:
-
- A summary of key performance factors like Return to Player (RTP), Hit Frequency, and Volatility
- Reel Symbols and Strips
- The Pay Table for line wins
- Wild symbol probabilities and payouts
- Scatter symbol probabilities and payouts
- Free Spin features
- Bonus Game features
- Other special features, such as multipliers or expanding wilds
Par sheets for physical slot machines might include additional data about physical limitations or features of the mechanical reels.
A Simple PAR Sheet Example
A PAR sheet presents the theoretical probabilities and payouts for a slot machine game. Generally it lists all the possible combinations of reel positions on a slot, determines how many of those represent “winners” vs. “losers,” and then calculates the overall RTP (also known as payback percentage) from that.

I’ll start with a simple example for a three-reel slot machine with one payline. This is a PAR sheet for one of the all-time classic slot machines, Charles Fey’s Liberty Bell. Released in 1899, the Liberty Bell had a number of technical innovations and became the most popular slot machine of its day. It’s a great example of a simple three-reel, one-line slot.
Summary and Performance Statistics
In the first section of the PAR sheet I like to summarize the basic rules and features of the game, and the key performance indicators,
This acts like an executive summary of the game design, and makes it easy for reviewers to see the key features and values at a glance.
Reel Strips and Symbol Distribution
The next section lists all of the slot symbols as they appear, in order, on each of the reels. They are indexed as “stops,” a term which refers to the possible stopping positions of the mechanical disks used on physical slot machines.

The order of the symbols on the reel can make a big difference. In multi-line slot machines, for example, ordering symbols differently on the reels can influence the number of line wins per play.
In the single payline Liberty Bell game, the order does not affect the math, but it does reflect the actual reel strips that Fey used in his classic machine.
The Symbol Distribution section counts the number of each type of symbol on each reel, to make the combinatorial math formulas simpler in the next section. It also shows the total number of symbols per reel, which are multiple to show the Total Ways.
The Liberty Bell has 10 symbols on each reel, meaning there are 1,000 Total Ways, or possible combinations of the three stop values.
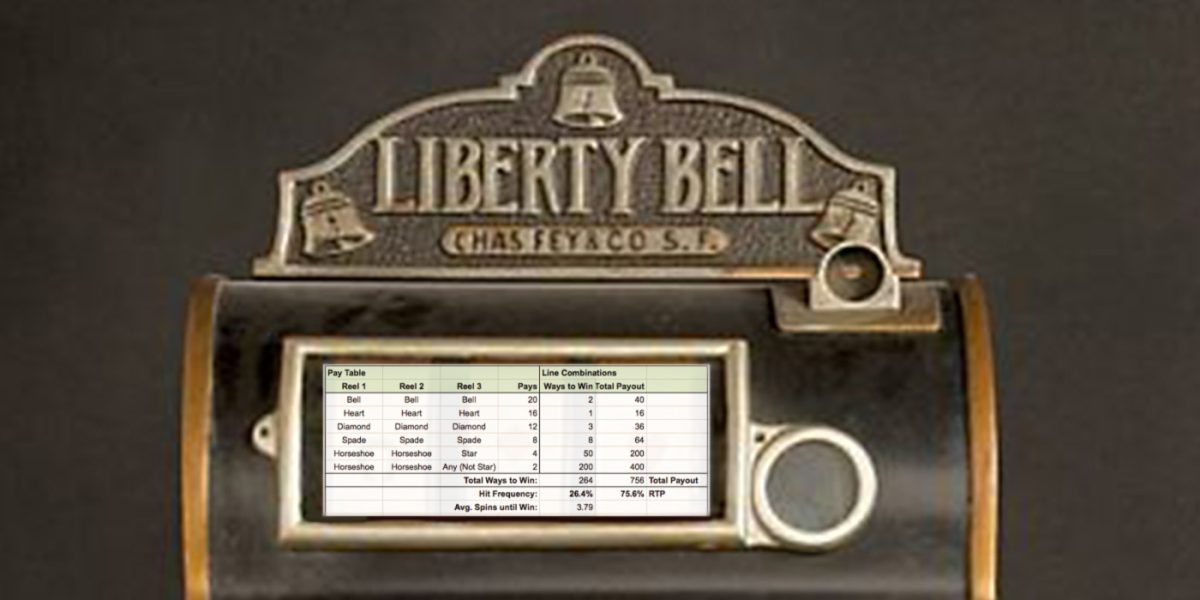
Pay Table and Ways to Win
The Pay Table lists all of the winning symbol combinations and how much they pay, in terms of a multiplier of the bet unit.
Most PAR sheets assume a bet unit of one credit, to simplify the math involved. This is fine for simple games, as long as all of the payouts scale exactly with the bet amount.
In a more complicated example the Pay Table might have its own tab or section in the spreadsheet. In this example, the Pay Table and Line Combinations sections are combined.

The Pay Table lists each of the 3-symbol combinations and its associated payout value.
The real work happens in the Line Combinations section. The Ways to Win column multiplies the values from the columns in the Symbol Distribution section to determine how many combinations are theoretically possible for each winning outcome. The formulas for the Liberty Bell are quite simple, as you can see in the spreadsheet.
Now we can calculate two important values. First is the Hit Frequency, which represents how often a player will win something from a play of the game. This is a one payline game so the Hit Frequency formula is simply:
(Total Ways to Win)/(Total Ways) = 264/1000 = 26.4%
Another way to look at Hit Frequency is in terms of how many spins, on average, it takes for a player to win something. For the Liberty Bell this is roughly one win every four spins:
1/(Hit Frequency) = 3.79
In this game, all the line payouts are higher than one credit, but in other games the Hit Frequency also includes wins that are less than original bet amount. We’ll talk about the effects of those kinds of “false wins” in future posts.
The other key value is the Return to Player (RTP), which is the amount that a player can expect to win on any given spin.
(Total Payout)/(Total Ways) = 756/1000 = 75.6%
An RTP of 75.6% indicates that for every dollar a player put into a Liberty Bell machine, they could expect to win roughly 75 cents in return.
These formulas take an average of all the possible winning line combinations and line win payouts to arrive at these figures. Theoretically, it is like a player spun this machine 1,000 times (the Total Ways) and received each possible combination of stops one time, also known as a full cycle. (This concept can be applied later if you write programs to simulate slot game outcomes and validate the PAR sheets.)
The RTP is one of the most important values to present in the PAR sheet. In most cases when designing a new slot game you will target a specific RTP range (or ranges), while also balancing Hit Frequency, Volatility, and other factors. We’ll discuss all of these factors in more detail in future posts.
Underlying Assumptions
This is a very simple example of a PAR sheet but it illustrates some core assumptions:
-
- A PAR sheet usually assumes a simple bet of one credit per play.
- Ways to Win calculations are defined for only a single payline. This is true even for multiline games — though there are exceptions to this rule, as we’ll see later.
- RTP and Hit Frequency values are calculated as if a player received every possible combination of reel stops one time, or a full cycle.
The full Liberty Bell spreadsheet is available for review. Feel free to make a copy and play around with it to update the Liberty Bell math however you like. For example, what changes could you make to you increase the RTP to 90% without changing the reel strips? How could you increase the Hit Frequency to 29% or more?
In future posts I’ll present more complicated examples and show how to handle features like multi-line games, Wild symbols. and Scatter symbols. Leave a comment if there are other features you’d like to see illustrated. I’m also happy to hear from other slot game designers and learn whether these concepts match the PAR sheets you’ve created before.
I want to build my own simulated machine. I have the basics of how the RNG works, and how to translate that to a spin combination.
What I’m struggling with, is how to distribute the symbols on the reels. Is there a mathematical formula that can be used to work it out, or do you simply try it and work out the hit rate and volitility, and change as you wish?
I was using a genetic algorithm to distribute the symbols on the reels to achieve a given RTP.
You can also study a volatility that way. Or optimize both ( rtp and volatility ) in the same time.
Thank you for this write-up. I found this very informative as I am creating my own slot machine and found that pay back percentage and hit rate were a lot harder to figure out than I thought. Looking forward to any more insight you can share about these topics.
It’s very useful information!
I would appreciate it if you could give me more useful information in the future!
I’ll keep checking if you have a useful post associated with the slot machine.
Hello and thank you for the break down you have given. I am no math genius , but I want to am in the process of designing a slot game , but with a twist .I really need help anywhere i can get it. Again thank you for putting out such a great resource. It is impossible to find a direct answer or procedure anywhere. Guess once someone has figured it all out. unlike yourself they keep it to their selves.
Kevin Nipper